TSX animation and MP4
Animate TSX figures with typed state timelines, and export them to GIF and MP4. For new motion work, use films.
This page covers animation of TSX figures with createAnimation(theme). It suits a figure that already exists and needs to change over time. For new motion work, use a film, which draws vector objects directly and renders many times faster.
Export an existing TSX animation directly with vizmatic video:
vizmatic video ./lesson.tsx --out ./videos --theme dark --fps 30
vizmatic video ./lesson.tsx --out ./videos --theme dark,light --fps 60 --audio narration.wav
The module exports width, height, and createAnimation(theme), just like the GIF examples. The video command samples the timeline at exact video timestamps, renders each React scene, and streams it to FFmpeg. It writes lesson_dark.mp4 and a video-manifest.json. Use --crf 18 for crisp text, --preset medium for a smaller file, and --scale 2 for twice the pixel dimensions. FFmpeg with libx264 is required; audio export also needs AAC. MP4 requires an opaque background, with the theme background used by default. Set --background to an opaque CSS color to choose another fill. The browser builder exports GIF; MP4 encoding runs in Node.js.
Render a complete video example#
The short request lifecycle starter shows one request moving through a three-step workflow. It uses only Vizmatic's published package and keeps the motion tied to the work being explained. The longer From noise to signal film shows a chart, synthetic observations, and a fitted trend.
In a Node.js 20 or newer project, install Vizmatic and React. Install FFmpeg separately and check that its encoder list includes libx264. Audio output also needs the aac encoder.
For a fresh app, add the consumer security overrides before installing.
npm install --save-dev vizmatic@0.6.0 react
npx vizmatic video ./request-lifecycle.tsx --out ./dist/videos --theme dark --fps 30
The CLI writes request-lifecycle_dark.mp4 and video-manifest.json under ./dist/videos. Add narration with --audio ./narration.wav; the audio is trimmed or padded to the animation duration and encoded as AAC. Vizmatic renders the picture and optional audio. Keep .vtt or .srt captions as separate files and synchronize their cues to the finished timeline. The downloadable source and a copyable command are also on the website video example.
The same workflow is available through the API:
import { renderAnimationVideo } from "vizmatic"
import { createAnimation, width, height } from "./lesson"

await renderAnimationVideo(createAnimation("dark"), {
  width, height, fps: 30, theme: "dark",
  outputPath: "videos/lesson.mp4",
  crf: 18, preset: "medium",
  // audioPath: "narration.wav",
})
Video supports 1–120 fps independently of the GIF cadence. Canvas dimensions after scaling must be positive even integers. Every frame is checked for overflow; failures report its timestamp and timeline label and preserve an existing output file. signal, audio alignment, and streaming use the same contracts as renderRgbaVideo below. Keep a finite film's last state visible long enough to read. Use parallel tracks for overlapping transitions and path helpers for continuous motion.
Watch **From noise to signal**, an 18-second motion design example built from examples/videos/signal-to-story.tsx. Its chart fits actual least-squares coefficients to explicitly synthetic data. The source demonstrates staggered entrances, arc-length line reveals, parallel tracks, camera motion, and an ending held on screen. From a repository checkout, generate the film, posters, captions, and downloadable source with:
pnpm install --frozen-lockfile
pnpm render:video
The repository's pnpm render:video script regenerates the showcase poster, captions, downloadable sources, and MP4. pnpm site:build regenerates the website preview and source downloads without encoding the MP4. Those generated media files live under docs/assets/video/ and are excluded from Git. Pages builds the MP4 and verifies it with pnpm docs:check --require-video before publication. The website loads the poster until playback is requested and provides chapter controls and a text description.
renderRgbaVideo streams caller-rendered RGBA frames to FFmpeg as an H.264 MP4. It supports 1–120 fps, even pixel dimensions, optional audio, and backpressure, without retaining the whole film in memory. Install FFmpeg with libx264 and AAC support separately. Canvas painters can use the optional @napi-rs/canvas package:
import { createCanvas } from '@napi-rs/canvas'
import { renderRgbaVideo, pointAlongPath, tracePolyline } from 'vizmatic'

const canvas = createCanvas(1280, 720)
const ctx = canvas.getContext('2d')
const path = [{ x: 150, y: 550 }, { x: 640, y: 200 }, { x: 1130, y: 550 }]

await renderRgbaVideo((frame) => {
  ctx.fillStyle = '#101827'
  ctx.fillRect(0, 0, 1280, 720)
  const progress = Math.min(1, frame.time / 2000)
  const visible = tracePolyline(path, progress)
  ctx.beginPath()
  visible.forEach((point, i) => i ? ctx.lineTo(point.x, point.y) : ctx.moveTo(point.x, point.y))
  ctx.strokeStyle = '#63deec'
  ctx.lineWidth = 5
  ctx.stroke()
  const point = pointAlongPath(path, progress)
  ctx.beginPath()
  ctx.arc(point.x, point.y, 14, 0, Math.PI * 2)
  ctx.fillStyle = '#f4d477'
  ctx.fill()
  return canvas.data()
}, {
  width: 1280, height: 720, duration: 3000, fps: 30,
  outputPath: 'lesson.mp4',
  // audioPath: 'narration.wav',
})
Durations and frame.time are milliseconds, as in typed animation timelines. videoFrameSchedule(duration, fps) lazily yields the same frame timestamps; the endpoint is not emitted as an extra frame. The callback can be async and must return exactly width * height * 4 bytes. Each frame is consumed before requesting the next. Optional audio is padded or trimmed to the video duration and encoded as stereo AAC at 48 kHz and 384 kbit/s. signal cancels an export. A failed callback or encoder removes temporary files and preserves an existing output.
Use defineAnimation and sampleAnimation(animation, frame.time) to drive multiple properties from a shared timeline. Sample per frame rather than building a GIF frame array for a long video.
Motion helpers operate on { x, y } points:
tracePolyline(points, progress)reveals a path by actual arc length.pointAlongPath(points, progress)locates a moving marker on the same path.morphPolyline(from, to, progress, { samples, easing })smoothly changes one path into another, including paths with different vertex counts. It matches equal arc-length positions, uses 64 samples andsmoothstepby default, and preserves the inputs. Use it for trajectories and changing curves.createPolylineMorph(from, to, options)prepares the same arc-length correspondence once and returns a(progress) => pointssampler. Reuse it across frames to avoid repeating path measurement and resampling.arcSwap(from, to, progress, { lift, easing })exchanges positions along opposite arcs.liftis the maximum perpendicular displacement, defaulting to 80; the default easing issmoothstep.smoothstep(progress)clamps and eases progress between zero and one.
Path results use fresh points and handle repeated vertices. Empty paths trace to an empty array; following an empty path throws. These helpers let a lesson draw a curve, trace a computation graph, or exchange token positions while keeping the underlying numerical state explicit.
createCanvasComponents(painter) provides reusable panels, labeled cards, matrices, token rows, and moving particles for a Canvas video renderer. Inject the renderer's drawing interface, including its containment and opacity scopes. Every component uses those methods, so host layout checks and shape metadata remain available. The components use no raw Canvas operations or raster intermediates.
import { createCanvasComponents, type CanvasPainter } from 'vizmatic'

// The host supplies checked primitives. Scope callbacks must keep those
// checks active, and opacity must restore drawing state with try/finally.
function drawLesson<Shape>(painter: CanvasPainter<Shape>) {
  const scene = createCanvasComponents(painter)
  const node = scene.card({
    x: 40, y: 40, width: 160, height: 68, label: 'query',
    fill: '#18283b', stroke: '#63deec', textColor: '#fff',
  })
  scene.matrix({
    values: [[1, -2], [3, 4]], x: 240, y: 40, cellSize: 80,
    style: { fill: '#18283b', textColor: '#fff', fontSize: 26 },
    cellStyle: (value) => ({ labelOpacity: value < 0 ? 0.5 : 1 }),
  })
  scene.tokenRow({
    values: ['dogs', 'chase', 'cats'], centerX: 300, y: 240,
    fill: '#18283b', textColor: '#fff', reveal: 0.6,
  })
  return node // Original host geometry, usable for connector anchors.
}
Panels default to a container scope with 10 pixels of padding and a 14 pixel corner radius; pass scope: 'label' for a label-only scope. Cards center their label with a baseline offset of fontSize * 0.34. opacity affects the whole card; labelOpacity reveals the text independently. Panel and card geometry remains available at zero opacity. Finite opacity values are clamped to the range from zero to one before composing fades or token reveals. Non-finite opacity values throw. Matrices and token rows skip invisible cells or items. Matrix format(value, row, column) and cellStyle(value, row, column) customize individual cells without rebuilding the component.
Panels and cards accept focusTarget, including through a matrix's cellStyle. Flow-graph nodes and edges, timeline lanes and intervals, and allocation parts accept the same field. Grids accept cellFocusTarget(row, column). These call the optional host painter.target(id, draw) around the actual painted object, retaining the original geometry and all host checks.
createFocusDirector(painter, { cues }) samples already timed semantic cues. The host applies director.paint(draw, originalAlpha) to its checked primitives and director.target(id, draw) to related marks. The active target retains its authored brightness while surrounding marks dim. minimumContextAlpha can keep fading context legible without making a mark brighter than its authored alpha. reveal(id, draw) preserves geometry before a cue, progress(id, fallback) drives a transformation, and completed reveals remain visible. Supply measured cue times from the narration provider; the director does not estimate speech.
focusFrame({ bounds, strength, avoid, clip }) adds corner annotations through the checked painter. Pass visible label bounds in avoid to move annotations away from text. Crowded annotations are omitted while the brightness cue remains. mergeFocusRegions(parts) groups adjacent parts of one semantic object and keeps distant parts separate. All focus state is sampled per frame, so seeking and parallel frame rendering preserve the same result.
layoutTokenRow(values, options) returns { text, x, width } items for shared layout and connector placement. Automatic widths use the literal spelling; pass width for fixed-width cards. x takes precedence over centerX. tokenRow adds staggered reveal, with each item's opacity equal to clamp(reveal * itemCount - index, 0, 1). Use particle({ points, progress, fill }) to move a marker by route length; endpoints remain unpainted.
createTeachingCanvas(painter) adds checked axes, traced curves, scatter plots, positive bar charts, and explicit-layout flow graphs. Supply a TeachingPainter with the same checked methods plus math, line, arrow, path, and connect. Its connect method returns { from, to } endpoints. No component bypasses the host's paint, containment, or opacity checks.
Construct a result before revealing it#
The teaching canvas also offers five components for explanations with persistent objects and computed intermediate states:
| Method | State and drawing contract |
|---|---|
vectorAccumulation | Accumulate ordered weighted vectors. Each term retains its ID, contribution, and endpoints. Use an equal-unit two-dimensional plot or declare a projection. revealTotal controls the displayed result independently of construction progress. |
categoricalSampling | Map supplied uniform draws through a categorical CDF. Declare probabilities or weights, retain draw IDs, and expose the empirical distribution with a separate showEmpirical flag after all retained draws arrive. |
routedTransfer | Plan an orthogonal route around declared obstacles. Clearance includes the stroke and moving marker. An impossible route fails before painting. |
byteDifference | Compare Uint8Array values with stable byte offsets, escaped controls, and explicit gaps. Scanning and the final equality verdict have separate controls. |
tokenHistory | Align prompt, accepted, processed, KV, and emitted occurrence IDs. Dropping and replaying KV preserve accepted output and rebuild the processed prefix. |
The corresponding pure helpers are weightedVectorState, categoricalSampling, planTeachingRoutedTransfer, byteDifferenceState, and tokenHistoryState. They sample explicit inputs and support out-of-order frame rendering. The lesson supplies the data, model assumptions, and narration cues.
Provide painter.measureText(value, size, font) to size moving token copies with the same font metrics used by painter.text. The helper adds the label's padding and keeps the copy inside its occurrence column. Without this optional method, the copy retains the full column width so a readable whole-word label does not shrink into a fixed three-character card.
Compare the same moving word token in v0.7.0 and v0.7.2.
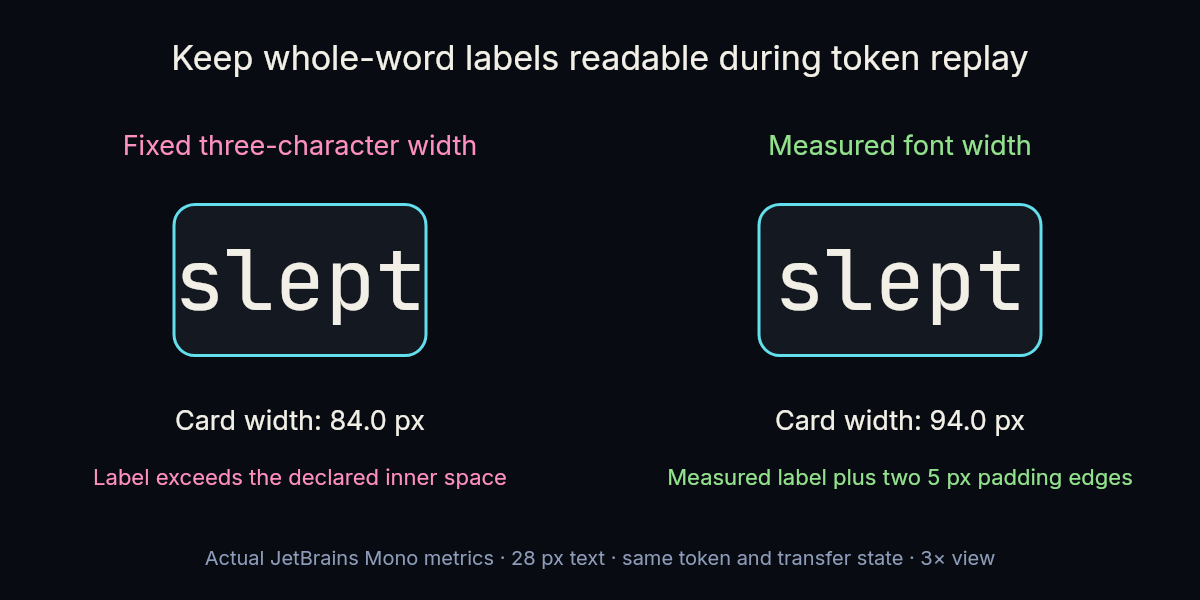
Keep each component's scope visible in the explanation. The byte comparison aligns a common prefix and suffix with a positional middle; it does not compute a minimum-edit diff or establish artifact provenance. Categorical sampling uses the supplied draws and performs no hidden random experiment. Token history models ordinary autoregressive decoding with at most one accepted token awaiting processing. Speculative decoding needs its own verification contract. assertTokenHistoryTransition checks authored drop and replay transitions without storing mutable state in the renderer.
The package includes worked examples in examples/_teaching/teaching-weighted-vector.ts, examples/_teaching/categorical-tail-loss.ts, examples/_teaching/teaching-routed-transfer.ts, examples/_teaching/teaching-byte-diff.ts, and examples/_teaching/teaching-token-history.ts. Render the prediction, intermediate, and payoff states at the intended output resolution. Check moving marks against actual glyphs as well as declared card bounds.
Use changeCue to mark a numerical update in an existing equation. The cue briefly highlights the changed region, then settles into the normal text color. Drive the plotted geometry and displayed value from the returned value so the number and its consequence move together:
import { createTeachingCanvas } from 'vizmatic'

const charts = createTeachingCanvas(painter)
const update = charts.changeCue({
  x: 120, y: 160, width: 260, height: 80,
  from: 20, to: 10, progress: updateProgress,
  color: '#F4D477', restColor: '#E9EFFF',
}, ({ value, color }) => {
  painter.math(`m=${value.toFixed(1)}`, 150, 215, 36, color)
})
// Plot the fitted line with update.value as its slope.
valueChange draws a labeled numeric card with the previous and target values and a signed delta. Supply format, fontSize, and explicit bounds; give a three-line card at least fontSize * 3 height. Both methods return value, previous, target, delta, changed, emphasis, and color. valueChangeState({ from, to, progress }) exposes the same numerical state and emphasis envelope without drawing. Progress is clamped to zero through one; unchanged values remain quiet. For an accelerated sequence, pass one steady emphasis envelope across the changing interval to avoid flashing on every iteration. All cues sample explicit inputs, so seeking and out-of-order frame rendering produce the same result.
Scatter markers with centers inside the closed data domains remain fully visible, including points on axis endpoints. Their circles can extend beyond the axis rectangle; the host audits that complete geometry. Leave room around the axes or pad the data domains when a surrounding container needs clearance. Centers outside the data domains are omitted.
import { createTeachingCanvas, sampleFunction, stableSoftmax } from 'vizmatic'

const charts = createTeachingCanvas(painter)
const plot = charts.axes({
  x: 160, y: 140, width: 640, height: 360,
  xDomain: [-3, 3], yDomain: [0, 1],
  xTicks: [-3, 0, 3], yTicks: [0, 0.5, 1],
  xLabel: 'Input', yLabel: 'Probability', gridColor: '#283447',
})
charts.curve({
  plot, points: sampleFunction(x => 1 / (1 + Math.exp(-x)), -3, 3),
  color: '#63deec', progress: 0.7,
})
charts.bars({
  x: 980, y: 140, width: 480, height: 360,
  values: stableSoftmax([2, 1, 0]), labels: ['cat', 'dog', 'bird'], max: 1,
})
Axes return { point(x, y), bounds, xDomain, yDomain }; plot bounds contain the data marks, while tick labels and titles occupy space outside the plot. Use axes({ ..., equalUnits: true }) to preserve angles and distances. This fits both requested domains at equal pixels per data unit and centers the resulting plot inside the requested rectangle. Returned bounds, axes, labels, point projection, and curve clipping use that fitted plot. The default fills the requested rectangle with independent horizontal and vertical scales. Curves return the visible mapped polyline and delegate clipping to the checked host. Scatter omits circles whose complete mark would extend beyond the plot. Bars accept nonnegative values and return { bars, slots, bounds }, preserving input indices with null for zero-height bars. slots describe full-height columns, including zero values. Progress is clamped to the unit interval.
flowGraph({ nodes, edges }) takes explicit node bounds and ID-based edges. It draws edges and optional moving particles behind the cards, then transfers host geometry metadata onto the connector references. The returned { nodes, routes } supports subsequent annotations and movement. Keep topic-specific numerical models in the lesson; share their chart and graph composition through this API.
transfer coordinates an attached connector and optional particle. Supply each painted card and its matching local opacity. Both marks use the minimum endpoint and edge opacity; a shared host frame scope multiplies that opacity once.
const route = charts.transfer({
  source: { shape: source, opacity: 1 }, target: { shape: target, opacity: 0.6 },
  progress: 0.5, color: '#63deec', particle: { radius: 9, fill: '#ffce73' },
})
Hidden endpoints return null; progress outside (0, 1) omits the particle. Gaps clear both cards by the marker/stroke extent plus margin (default 2), preserving larger requests. Coincident centers or insufficient room throw. The host must anchor rounded cards along their center ray and offset gaps along that ray. Original routes and shape references retain audit evidence; the host still checks intervening obstacles.
grid uses one panel and rows + columns - 2 paths. lineWidth controls internal lines; the border uses the host's rectangle stroke. Highlights and literal text labels stay scoped; label dimensions must match the grid.
Supply { x, y, width, height, rows, columns }; returns { shape, bounds, cells, cell(row, column) }. Connect to the painted shape; cells are label/math geometry. layoutCellGrid returns layout without paint.
timeline draws supplied intervals on named lanes. One time controls elapsed fills, completion flags, and the axis cursor. Intervals on the same lane must not overlap; use separate lanes for concurrent work. Bounds include the lane labels and time axis. Labels occupy their full planned span above the fill; omit labels on spans too narrow for the chosen font. Future intervals paint nothing, and visible interval labels use the same local opacity as their fill.
allocation draws a capacity-scaled strip and a value ledger from the same nonnegative parts. Unused capacity remains visible; over-allocation throws. Supply bounds tall enough for the header, strip, and one row per part plus Free. format and unit apply to the computed totals and ledger values.
const trace = charts.timeline({
  x: 140, y: 260, width: 1640, height: 300, domain: [0, 100], time: 50,
  lanes: [{ id: 'cpu', label: 'CPU' }, { id: 'gpu', label: 'GPU' }],
  intervals: [
    { id: 'submit', lane: 'cpu', start: 0, end: 20, label: 'Submit' },
    { id: 'kernel', lane: 'gpu', start: 20, end: 80, label: 'Kernel' },
  ],
})
const memory = charts.allocation({
  x: 260, y: 650, width: 1400, height: 370, capacity: 100, unit: 'GB',
  parts: [{ id: 'weights', label: 'Weights', value: 20 },
          { id: 'state', label: 'Optimizer state', value: 30 }],
})
// trace.intervals.kernel.elapsed === 30; memory.remaining === 50
Timeline results expose time, point(time) (the canvas x coordinate), live lane shapes, and ID-keyed intervals with shape, bounds, elapsed, complete, and local opacity. Zero elapsed time or zero opacity returns a null interval shape. Allocation returns used, remaining, capacity-strip bounds, freeBounds, ordered part geometry, the painted strip shape, and per-part shapes (null at zero area). Connect only to those painted references. layoutAllocation computes pure strip geometry for custom diagrams, with the supplied bounds as the strip.
createCueTrack holds one simulation snapshot until an explicit beat cue. Sample once and derive tables, metrics and decisions from that same snapshot.
import { createCueTrack } from 'vizmatic'

const cutoffs = createCueTrack({
  initial: { id: 'morning', snapshot: { cutoff: 540, ageHours: 8 } },
  cues: [
    { id: 'noon', beat: 3, at: 0.2, snapshot: { cutoff: 720, ageHours: 3.5 } },
  ],
})
const { id, snapshot } = cutoffs.sample({ beat: state.beat, beatP: state.beatP })
Cue IDs are unique and positions increase strictly. Commits are inclusive; beat-end 1 equals next-beat 0. End snapshots hold outside the cues. Beats are nonnegative safe integers; progress is [0, 1]. Definitions are copied and result records frozen; snapshots retain identity without mutation or cloning. Treat snapshots as immutable. The timeline still owns audio timing and motion.
Numerical helpers include seededRandom(seed), lerpArray, dotProduct, multiplyMatrices, stableSoftmax(values, temperature), entropy, normalizeVector, sampleFunction, gaussian(mean, sigma, x), and sampleGaussian(random). Softmax subtracts the largest logit before scaling; entropy accepts normalized probabilities; normalization preserves zero vectors. Seeded sampling makes simulations reproducible during rendering and review. Camera helpers keep world geometry and screen annotations aligned:
interpolateCamera(from, to, progress)eases a camera's world-space center and interpolates zoom logarithmically. OptionalminZoomandmaxZoomconstrain both endpoints.cameraSvgTransform(camera, { width, height })centers an SVG group on that camera.projectWorldPoint(point, camera, viewport)applies the same transform to a label anchor rendered outside the group.
Keep event progress separate from camera progress when cutting between views. The event can continue from its previous state while each shot has its own pan or zoom. Simulation time and camera movement can follow separate timelines.
Use renderMathSvg to typeset TeX into standalone SVG paths for a canvas, figure, or video frame:
import { renderMathSvg } from 'vizmatic'

const formula = renderMathSvg(String.raw`\frac{\partial L}{\partial W_x} + x^2`, {
  fontSize: 48,
  color: '#63deec',
})
// formula.svg contains glyph paths; width, height, and baseline are pixels.
The synchronous renderer supports AMS equations, fractions, subscripts, and superscripts. It returns baseline metrics for alignment with other labels, caches formulas, and isolates macro definitions between calls. Invalid TeX throws an error. SVG paths render with local assets and require no browser or network access.